
How To
How to Make a Chart in Google Sheets (Step-by-Step Guide)
Key Takeaways:Select your data and go to Insert > Chart to create any chart in secondsGoogle Sheets supports 30+
Create stunning charts and dashboards in Google Sheets. Data visualization best practices for clear, impactful reports.
Key Takeaways:Select your data and go to Insert > Chart to create any chart in secondsGoogle Sheets supports 30+

A thoughtfully built Google Sheets dashboard template does more than just organize data—it turns a static spreadsheet into a

Think of your web analytics dashboard as the command center for your business. It takes all the complicated, messy data
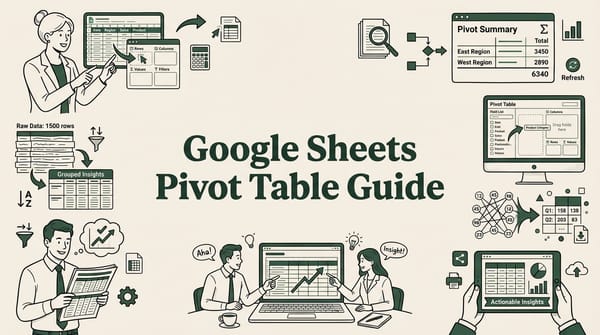
If you have thousands of rows in Google Sheets and need quick answers — total sales by region, average order value

Ever find yourself staring at a spreadsheet packed with numbers, wondering what it all really means? Adding a Google Sheets