
If you run reports, build dashboards, or wrangle datasets for a living, you've probably asked yourself: should I use Google Sheets or Excel for data analysis? Both tools have evolved dramatically, and the answer in 2026 isn't as simple as "Excel is more powerful." Each platform now has unique data analysis strengths that the other can't match. This guide compares Google Sheets vs Excel for data analysis specifically -- covering pivot tables, formulas, data connections, performance with large datasets, and collaboration -- so you can pick the right tool (or use both).
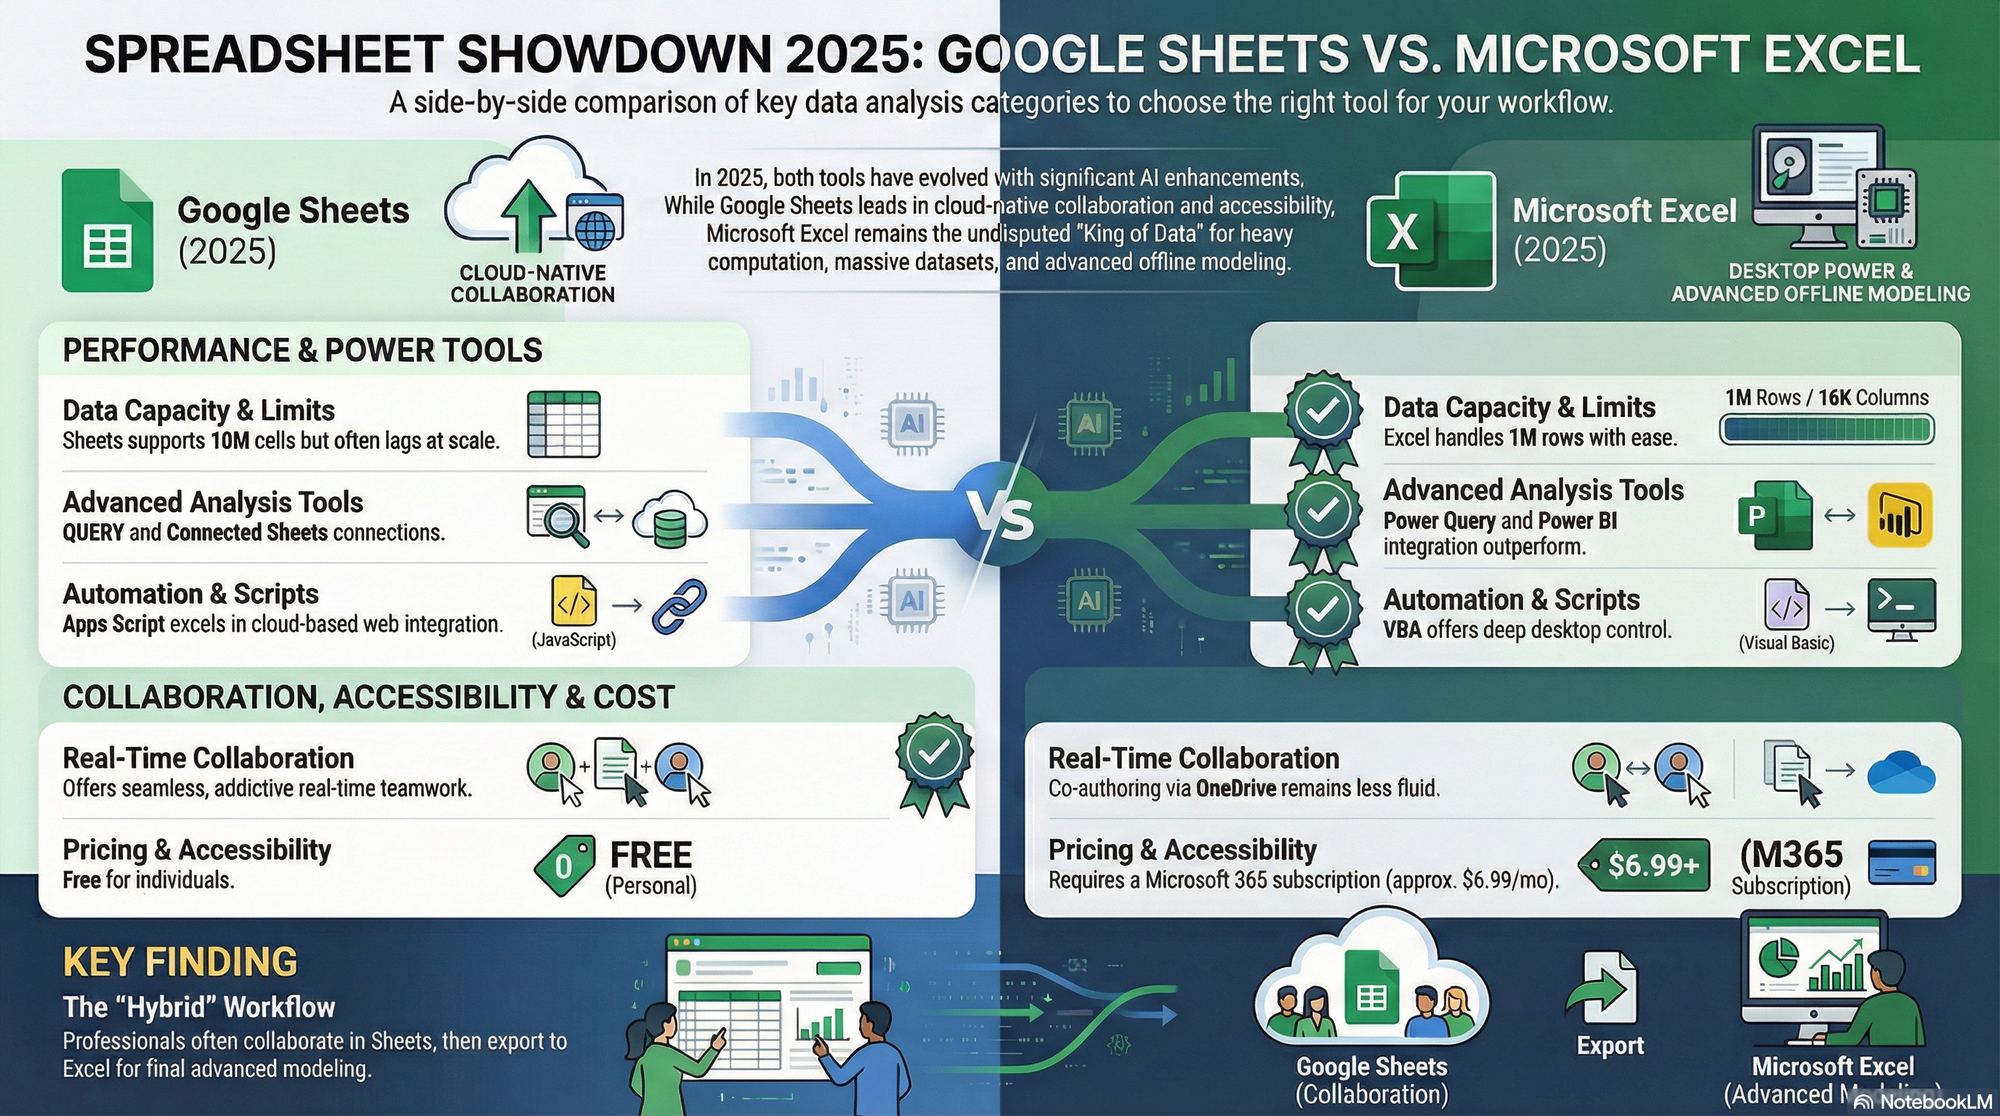
Key Takeaways:Excel wins for heavy analysis: Power Query, Power Pivot, and VBA handle complex modelingGoogle Sheets wins for collaborative analysis: real-time co-editing plus QUERY and Connected SheetsGoogle Sheets slows significantly past 100K rows; Excel handles 1M+ nativelyA hybrid workflow -- analyze in Excel, share via Sheets -- often works bestSmoothSheet bridges the gap by importing large Excel/CSV files into Sheets without crashes
Data Analysis Features Compared
Before diving into the details, here's a side-by-side snapshot of how Google Sheets and Excel stack up for core data analysis capabilities:
| Feature | Google Sheets | Excel (Desktop / 365) |
|---|---|---|
| Pivot Tables | Built-in, simpler interface | Advanced pivots with Power Pivot, DAX, and data model |
| Charts & Visualization | 20+ chart types, basic customization | 40+ chart types, treemaps, waterfall, sparklines, Power BI integration |
| Formula Engine | 400+ functions, QUERY, ARRAYFORMULA, LAMBDA | 500+ functions, dynamic arrays, XLOOKUP, LET, Power Query M formulas |
| Add-ins / Add-ons | Google Workspace Marketplace (free/paid) | Office Add-in store + COM add-ins + VBA |
| Data Connections | IMPORTDATA, IMPORTHTML, Connected Sheets (BigQuery) | Power Query (200+ sources), ODBC, OLE DB, REST APIs |
| Collaboration | Real-time co-editing, comments, version history | Co-authoring in 365 (slower sync), limited in desktop |
| Data Limits | 10 million cells per spreadsheet | 1,048,576 rows x 16,384 columns per sheet (17B+ cells) |
| Automation | Apps Script (JavaScript) | VBA, Power Automate, Office Scripts (TypeScript) |
| Price | Free (Workspace from $7.20/user/mo) | $6.99/mo (Personal) or $12.99/mo (Family/Business) |
The table makes one thing clear: Excel has deeper analysis tools, while Google Sheets makes analysis more accessible and collaborative. Let's break down where each one truly shines.
Where Excel Wins for Data Analysis
If raw analytical horsepower is what you need, Excel remains the industry standard. Here's why data analysts, financial modelers, and BI teams still depend on it.
Power Query: ETL Without Code
Power Query is Excel's killer feature for data analysis. It lets you connect to over 200 data sources -- SQL databases, REST APIs, SharePoint, web pages, PDFs, cloud services -- and transform data with a visual, step-by-step editor. You can merge tables, unpivot columns, split fields, and clean messy data, all without writing a single formula. Google Sheets has nothing comparable; IMPORTDATA and IMPORTHTML are useful but limited to basic URL-based pulls.
Power Pivot and the Data Model
Excel's built-in data model lets you create relationships between multiple tables and write DAX (Data Analysis Expressions) formulas for advanced calculations -- think calculated measures, time intelligence, and complex aggregations across millions of rows. Power Pivot compresses data in memory, so you can analyze datasets far larger than what fits in a normal worksheet. Google Sheets pivot tables, while perfectly fine for everyday summaries, don't support multi-table relationships or custom measures.
Large Dataset Handling
An Excel worksheet holds 1,048,576 rows by 16,384 columns. With Power Pivot's in-memory engine, you can load tens of millions of rows without hitting a wall. Google Sheets maxes out at 10 million cells total per spreadsheet (and realistically, performance degrades well before that). If your analysis routinely involves 500K+ rows, Excel is simply more practical -- unless you pair Google Sheets with Connected Sheets, which we'll cover below.
VBA and Macro Automation
VBA (Visual Basic for Applications) has been powering custom analysis workflows for decades. Financial models, Monte Carlo simulations, automated report generation -- VBA scripts can do things that Apps Script can't easily replicate, especially when working with COM objects, file system operations, or high-performance loops over large arrays. For analysts who've built years of VBA tooling, switching to Sheets means rewriting everything in Apps Script.
Advanced Charts and Visualization
Excel offers more than 40 chart types including treemaps, sunbursts, waterfall charts, box-and-whisker plots, and geographic maps. You can layer trendlines, error bars, and custom formatting with pixel-level precision. Google Sheets charts are clean and functional, but comparatively basic. And if you need even more, Excel integrates directly with Power BI for interactive dashboards.
Where Google Sheets Wins for Data Analysis
Excel may have deeper tools, but Google Sheets has a different set of advantages that matter enormously in modern, team-based analytics.
Real-Time Collaboration
This is the big one. Multiple people can analyze the same dataset simultaneously -- editing formulas, building pivot tables, adding charts -- without version conflicts or "file is locked" errors. Comments, suggestions mode, and granular sharing permissions make it easy to review each other's analysis. Excel 365 supports co-authoring, but the experience is noticeably slower and less reliable than Sheets' native real-time sync.
The QUERY Function
Google Sheets' QUERY function is a genuine competitive advantage. It lets you run SQL-like queries directly on your spreadsheet data -- filtering, grouping, aggregating, sorting, and even pivoting -- all within a single formula. There's nothing equivalent in Excel. A formula like =QUERY(A1:E1000, "SELECT B, SUM(E) WHERE C='Active' GROUP BY B ORDER BY SUM(E) DESC") replaces what might take a pivot table plus several helper columns in Excel. For analysts who think in SQL, this alone can justify using Sheets.
Connected Sheets and BigQuery
Connected Sheets is Google's answer to Excel's Power Pivot, and in some ways it goes further. With a Google Workspace Enterprise or Enterprise Plus plan, you can connect Google Sheets directly to BigQuery datasets containing billions of rows. You create pivot tables, charts, and formulas that run server-side against the full dataset -- your spreadsheet stays responsive because the heavy computation happens in Google's cloud. If your company already uses BigQuery for data warehousing, this is a massive advantage over Excel.
IMPORTDATA and Live Data Feeds
Functions like IMPORTDATA, IMPORTHTML, IMPORTXML, and IMPORTRANGE let you pull live data directly into your analysis. You can import CSV files from URLs, scrape tables from web pages, pull data from other Sheets, and build dashboards that update automatically. While Power Query can do all of this (and more), Google Sheets functions are simpler to set up and always live. For quick competitive analysis or monitoring, this wins on convenience.
Add-on Ecosystem and Integrations
The Google Workspace Marketplace has thousands of add-ons for extending Sheets' analysis capabilities. Tools like SmoothSheet let you import large CSV and Excel files directly into Sheets using server-side processing -- bypassing the browser memory limitations that normally cause crashes with files over 50,000 rows. Other add-ons connect to Salesforce, HubSpot, Stripe, and dozens of other platforms, making Sheets a surprisingly capable data hub.
Free and Accessible
Google Sheets is completely free with a Google account. No license management, no activation headaches. For startups, freelancers, and teams on tight budgets, Sheets offers about 80% of Excel's analysis power at zero cost. That's hard to argue with.
Performance Comparison: How They Handle Large Data
Data analysis capabilities are meaningless if your tool chokes on the dataset you need to analyze. Here's how Google Sheets and Excel perform at different data volumes:
| Scenario | Google Sheets | Excel Desktop |
|---|---|---|
| 100,000 rows | Usable but noticeably slow; formulas recalculate in 2-5 seconds | Smooth; pivot tables and charts respond instantly |
| 500,000 rows | Very sluggish; complex formulas may time out; pivot tables struggle | Good performance; Power Query handles transforms easily |
| 1,000,000+ rows | Exceeds practical limits; Connected Sheets required for BigQuery data | Native support up to 1,048,576 rows; Power Pivot handles 10M+ in-memory |
For most teams, the practical crossover point is around 100,000 rows. Below that, Google Sheets handles analysis tasks comfortably. Above that, you're better off in Excel -- unless you use Connected Sheets with BigQuery, which shifts the computation to the cloud and keeps Sheets responsive.
There's a middle-ground solution worth knowing about. If your data starts in CSV or Excel format and you need to analyze it in Google Sheets, SmoothSheet imports files up to 10 million cells using server-side processing. Instead of your browser trying to parse a 200MB Excel file and crashing, SmoothSheet handles the heavy lifting on its servers. At $9/month, it's a fraction of the cost of re-architecting your workflow around BigQuery.
You can also use our free Google Sheets Limits Calculator to check whether your dataset will fit within Sheets' constraints before you start your analysis.
Can You Use Both? The Hybrid Workflow
The most effective approach for many teams is to use both tools, playing to each one's strengths. Here's a practical hybrid workflow:
Analyze in Excel, Share in Sheets
Do your heavy data processing in Excel -- Power Query transformations, Power Pivot modeling, complex DAX calculations -- then export the summarized results to Google Sheets for collaborative review. Your team can comment, discuss findings, and build on the analysis without needing Excel licenses. We covered the conversion process in detail in our guide to converting Excel to Google Sheets.
Collect in Sheets, Crunch in Excel
Use Google Sheets as your data collection layer -- forms, IMPORTDATA feeds, team input -- then periodically export to Excel for deeper analysis. This works well for survey data, sales tracking, and any workflow where multiple people contribute data but one analyst builds the models.
Import and Export Between Them
Moving data between Sheets and Excel is straightforward. Google Sheets can open .xlsx files directly and export to .xlsx at any time. Most formulas translate automatically. The main friction points are:
- VBA macros don't transfer (you'd need to rewrite in Apps Script)
- Power Query connections break when opened in Sheets
- Conditional formatting rules may render differently
- Large files can crash during browser-based upload -- this is where SmoothSheet's server-side import helps
For a more detailed look at what Excel features don't carry over, see our post on Excel features not in Google Sheets.
Frequently Asked Questions
Is Google Sheets good enough for data analysis?
Yes, for most use cases. Google Sheets handles pivot tables, charts, the QUERY function, and datasets up to about 100,000 rows comfortably. For basic to intermediate data analysis -- trend spotting, summary reports, live dashboards -- it does the job well. You'll only outgrow it when you need Power Query-level ETL, multi-table data models, or analysis on 500K+ rows.
Can Google Sheets replace Excel for analysts?
It depends on the type of analysis. For collaborative reporting, SQL-style data queries, and live data feeds, Google Sheets can replace Excel. For financial modeling, large-scale data transformation (Power Query), and advanced statistical analysis, Excel is still necessary. Many analysts use both, choosing the tool that fits each specific task.
Why is Google Sheets slow with large datasets?
Google Sheets runs entirely in your web browser, which has limited memory and processing power compared to a desktop application. Every formula recalculation, pivot table refresh, and cell update requires round-trip communication with Google's servers. Past 100,000 rows, these factors compound and cause noticeable lag. Pivot tables on large datasets can be particularly slow.
What's the best way to analyze large CSV files in Google Sheets?
First, check whether your file fits within Google Sheets' 10 million cell limit using the Limits Calculator. If it fits, use SmoothSheet to import it via server-side processing -- this avoids browser crashes that typically happen with files over 50,000 rows. Once imported, use pivot tables and the QUERY function for analysis. If your data exceeds 10 million cells, consider Connected Sheets with BigQuery or splitting the file first.
The Bottom Line
There's no single winner in the Google Sheets vs Excel data analysis debate. Excel dominates heavy analytical work -- Power Query, Power Pivot, VBA, and million-row datasets are in a league Google Sheets can't touch. Google Sheets dominates collaborative analysis -- real-time co-editing, the QUERY function, Connected Sheets, and zero-cost access make it the smarter choice for team-based work.
The best approach? Use both. Analyze in Excel when you need the horsepower, share in Sheets when you need the collaboration, and use tools like SmoothSheet to move data between them without the headaches. Whichever tool you choose, the analysis quality ultimately depends on the analyst, not the software.