
The quickest way to get your data in order in Google Sheets is right in the Data menu. You'll see two main options: ‘Sort sheet’, which organizes everything on your sheet based on one column, and ‘Sort range’, which lets you sort a specific selection of cells without touching anything else.
Your First Steps with Sorting in Google Sheets
Before we get into fancy formulas, let's nail the basics. Mastering the built-in sorting tools is the first and most important step for anyone looking to manage their data well. These options are your bread and butter for organizing everything from a simple contact list to a detailed sales report. They’re built right in, easy to use, and you don’t need to know a single formula to use them.
Think about a real-world scenario: a sales manager needs to quickly see which leads to follow up with. With a couple of clicks, they can sort their list by 'Last Contact Date'. Or maybe a marketing team wants to see which ad campaigns are hitting the mark. They can just sort by 'Click-Through Rate' to bring the top performers right to the top. This is how a messy spreadsheet becomes a clear source of insight.
Sort Sheet vs. Sort Range
In the Data menu, you'll see 'Sort sheet' and 'Sort range'. They sound almost the same, but they do completely different things.
- Sort sheet is the big one. It takes every single row on your sheet and rearranges it based on the column you choose. This is what you want when your whole sheet is one big, related table and everything needs to move together.
- Sort range is more like a scalpel. It only sorts the cells you’ve highlighted. This is perfect for when you have a small table on a larger dashboard and you want to organize it without scrambling all the data around it.
It's pretty simple: use 'Sort sheet' for the whole enchilada and 'Sort range' for just a slice. Getting this wrong can really jumble up your data, so it's a critical distinction to understand.
This is especially true for the millions of small businesses that rely on Sheets—in fact, 61% of U.S. small businesses name it their primary tool. Imagine a finance team scrambling to sort sales figures for a quarterly review. The ability to quickly organize data as it comes in from multiple people is what makes Sheets so powerful. You can find more details like this in these recent Google Sheets statistics.
Here's exactly where you'll find these two options in the 'Data' menu:
That simple dropdown is where the magic starts.
Comparing Basic Sorting Methods
Here’s a quick look at the two main UI-based sorting methods to help you choose the right one for your task.
| Feature | Sort Sheet (Data > Sort sheet) | Sort Range (Data > Sort range) |
|---|---|---|
| Scope | Sorts all data on the entire active sheet. | Only sorts the cells you've specifically selected. |
| Header Rows | Automatically detects headers but can be toggled. | You must manually select not to include the header. |
| Best For | Organizing a single, cohesive dataset (like a list of contacts or sales). | Sorting a small table on a dashboard or a section of a larger report. |
| Risk | Low risk, as all related row data moves together. | High risk of data mismatch if you don't select all related columns. |
Choosing the right tool is all about context. If your sheet is one big table, 'Sort sheet' is your safest and fastest bet. If you're working with multiple, separate blocks of data on one sheet, stick with the precision of 'Sort range'.
One tip I always give beginners: watch out for your header row! Google Sheets is pretty smart about identifying it, but always double-check that the 'Data has header row' box is ticked in the sort window. This keeps your column titles right where they should be—at the top. If you have a lot of data, locking those headers in place is a game-changer for scrolling. We have a whole guide on how to freeze panes in Google Sheets that shows you exactly how to do it.
Automating Your Data with Sorting Functions
While sorting from the menu is handy for a quick one-off analysis, the real magic happens when you let functions do the heavy lifting for you. Instead of constantly re-sorting your data every time a new row gets added, you can set up dynamic, self-organizing lists. This approach turns a static spreadsheet into a live dashboard that always shows the most current information.
The go-to tool for this is the SORT function. It works by creating a brand-new, perfectly sorted copy of your data somewhere else in your sheet, leaving your original dataset completely untouched. This is fantastic for building summary views, reports, or dashboards.
Think about it: you could have a master inventory list where you dump new products. On another tab, a formula could display a neatly sorted list, organized first by category and then by price from highest to lowest. Every time you add a new item, that sorted view updates instantly. No extra clicks needed.
The Versatile SORT Function
The basic syntax for the SORT function is refreshingly simple: =SORT(range, sort_column, is_ascending). You just point it at your data, tell it which column to use for sorting, and specify whether you want it A-Z (TRUE) or Z-A (FALSE).
Let's revisit that product inventory scenario. Say your product data lives in the range A2:D100. You want to sort everything first by Category (column C) and then by Price (column D).
- range:
A2:D100(This is all your product data) - sort_column 1:
3(Column C is the third column in our range) - is_ascending 1:
TRUE(We want categories sorted alphabetically) - sort_column 2:
4(Column D is the fourth column) - is_ascending 2:
FALSE(We want prices from highest to lowest)
The formula you'd type into a cell would be: =SORT(A2:D100, 3, TRUE, 4, FALSE).
This kind of dynamic sorting is a major reason so many teams rely on Google Sheets. It keeps everyone on the same page without messing up the source data. In fact, research shows that 56% of users choose Sheets over Excel for teamwork, partly because functions like this maintain data integrity even with the 100 concurrent editors Google now supports.
Finding the Top Performers with SORTN
Sometimes you don't need the whole list; you just want to see the winners. That's where SORTN is a lifesaver. It’s a specialized function built specifically to return the first 'n' items from a sorted dataset.
For example, if you're tracking ad campaigns, you could use SORTN to instantly pull the top five best-performing ads based on their conversion rate. It does the sorting and the trimming all in one go, making it incredibly efficient for building leaderboards or highlighting key data points.
Ultimate Control with the QUERY Function
For the highest level of sorting and filtering power, nothing beats the QUERY function. It lets you sort your data with an ORDER BY clause while also filtering it at the same time. Think of it as combining a sort and a filter into one super-powered command.
You could, for instance, pull all products from the "Electronics" category that cost more than $500 and then sort them by profit margin. This turns raw data into razor-sharp insights without needing any helper columns or complicated steps. We dive deep into this in our comprehensive guide to the Google Sheets QUERY function.
This flowchart can help you decide when to use the basic menu-driven sorting methods we covered earlier.
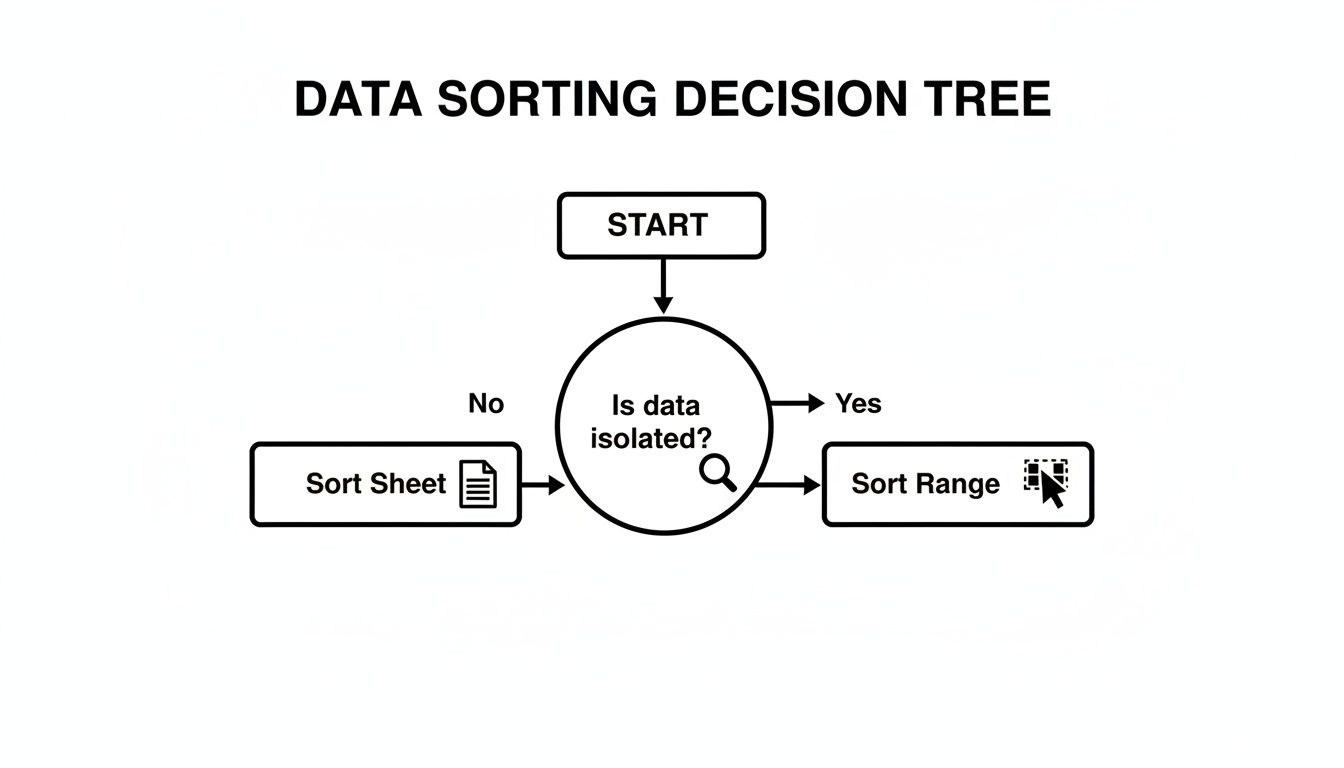
The main question it answers is whether your data is a self-contained table or part of a larger sheet with interconnected data.
Advanced Techniques for Complex Sorting Needs
Simple A-Z or 1-100 sorting gets you pretty far, but what happens when your data doesn't fit neatly into those boxes? You'll often need to organize information based on visual cues, unique business rules, or in a way that doesn't mess up what your teammates are looking at. This is where a few advanced sorting tricks come in handy.
These methods are your go-to when a straightforward alphabetical sort just won't cut it. Maybe you need to group project tasks by their status, which you've helpfully marked with cell colors. Or perhaps you're organizing survey feedback where green means positive and red means negative.
Organizing Data by Color
Sorting by color is a fantastic way to bring visual order to your spreadsheets. In Google Sheets, you can sort by either the cell's background color or the color of the text itself, which groups all the matching cells together. I find this incredibly useful for project dashboards where red might signal "at-risk," yellow means "in-progress," and green is for "completed" tasks.
To get this working, you first need to apply a filter. Just select your data and go to Data > Create a filter. Once you see the little filter icons in your headers, click the one for the column you want to sort. You'll find an option for "Sort by color." From there, just pick "Fill color" or "Text color" and select the specific color you want to pull to the top.
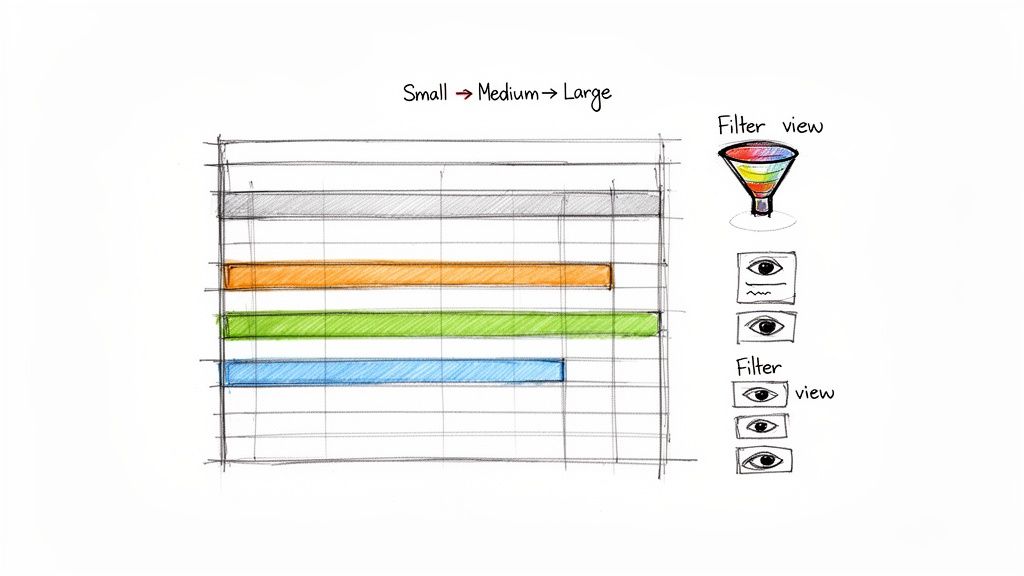
Creating a Custom Sort Order
Ever tried to sort T-shirt sizes? A standard A-Z sort will give you a jumbled mess like "Large," "Medium," "Small," "X-Large." To fix this, you need to tell Google Sheets the exact order you want, like "Small," "Medium," "Large," "X-Large."
The classic way to handle this is with a helper column and a quick formula. It sounds more complex than it is.
- Set up your logic: Somewhere out of the way (or on a new tab), create a small two-column table. The first column lists your items in the correct order (Small, Medium, Large). The second column assigns a number to each (1, 2, 3).
- Add a helper column: Back in your main data sheet, insert a new column right next to the one you need to sort.
- Pull in the numbers: Use a
VLOOKUPformula in the helper column to look up each T-shirt size and pull in its corresponding number from your little logic table. - Sort by the numbers: Now, just perform a standard sort on your whole dataset, but choose the new helper column as your sort key. Voila! Your data is now in the custom order you defined.
By creating this manual order, you're essentially translating your business logic into a format that Google Sheets can understand. It's a fundamental skill for managing complex inventories or project timelines. This approach is also useful when building reports, similar to how you might structure a Google Sheets pivot table to summarize data in a specific sequence.
Collaborating Seamlessly with Filter Views
Working on a shared spreadsheet can get chaotic fast. The moment you sort a column to find what you need, you've changed the view for everyone else, potentially derailing what your colleague was in the middle of analyzing. Filter Views are the perfect answer to this all-too-common headache.
Think of a Filter View as your own personal, saved version of the sheet's sorting and filtering. You can create a view called "My A-Z Client Sort" while a teammate has one called "Q4 Sales Only." When you activate your view, the sheet organizes itself just for you, but the underlying data remains untouched for everyone else.
This completely eliminates those "sorting wars" and makes working together in the same document a much smoother, frustration-free experience.
How to Fix Common Sorting Problems
Even those of us who live and breathe Google Sheets run into sorting headaches. Your data gets scrambled, formulas suddenly break, or dates just won't line up chronologically. It’s frustrating, but the good news is that these problems are almost always fixable once you know what to look for.
The most common casualty of a clumsy sort? Your formulas. When you use the basic "Sort range" or "Sort sheet" tools on a dataset with cell references (like =B2*C2), those references don't automatically adjust to the new row order. All of a sudden, your calculations are pointing at the wrong cells, kicking off a chain reaction of errors.
Preserving Your Formulas
The best way I've found to keep formulas from breaking is to separate your raw data from your sorted view. Instead of sorting your original table directly, just leave it alone. Then, on a new sheet, use a function like SORT or QUERY to pull in a dynamic, sorted copy.
For example, a simple formula like =SORT('Raw Data'!A2:F100, 3, TRUE) will grab all the data from your 'Raw Data' tab and display it neatly sorted by the third column. This whole process happens without ever messing with your original formulas. It’s a clean, non-destructive workflow where your calculations stay safe and your sorted list updates automatically as new data is added.
This method is a lifesaver for teams who need reliable data. Think about operations managers tracking projects—where 54% rely on Sheets—who sort timelines to spot potential delays. A broken formula could literally mean missing a critical deadline. You can dig into more interesting insights about Google Sheets usage if you're curious.
Handling Mixed Data Types
Another classic sorting problem is trying to sort a column that mixes numbers and text. Google Sheets gets confused and treats numbers formatted as text differently, often sticking them at the top of an A-Z sort, completely out of numerical order. This can derail your entire analysis.
To fix this, you need to make sure the column format is consistent.
- Look for sneaky apostrophes: Check for numbers with a leading apostrophe (like
'123), which is a shorthand way to force a number to be treated as text. - Use the VALUE function: In a new helper column, you can use
=VALUE(A2)to convert the text in cell A2 back into a real number. - Standardize the format: The simplest fix is often just to select the whole column, go to Format > Number, and apply the "Number" or "Automatic" format.
Dates are another big culprit. If some dates are typed in as text (e.g., "Jan 5, 2024") while others are true date values, they won’t sort chronologically. The easiest fix here is to highlight the column and apply a consistent date format from Format > Number > Date. This forces Sheets to recognize every entry as a proper date.
By keeping an eye out for these common traps, you can sort your data with confidence, knowing your results are accurate and reliable every single time.
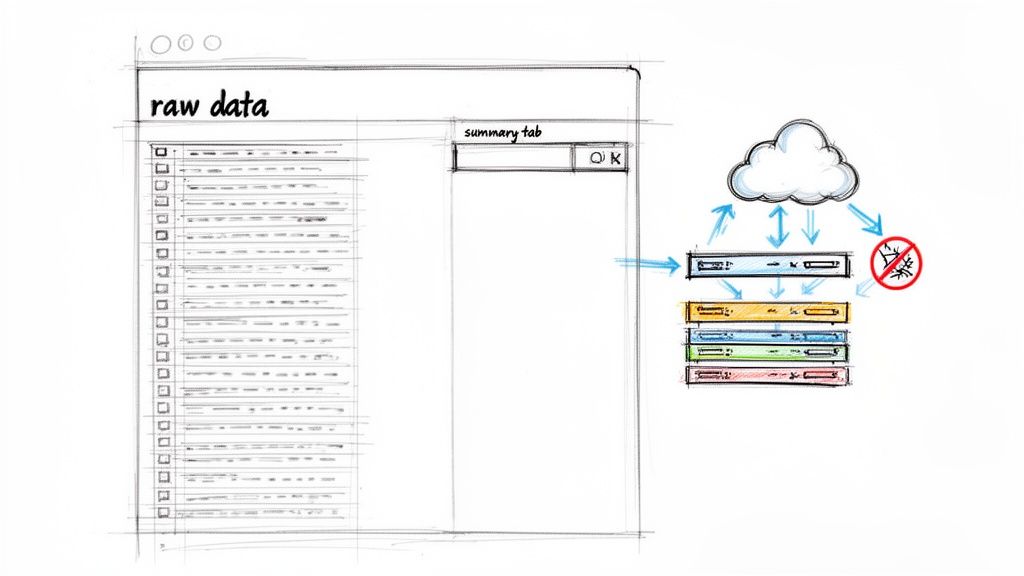
Sorting Large Datasets Without Crashing Your Browser
We’ve all been there. You try to sort a Google Sheet with a few hundred rows, and it's instant. But try that with tens of thousands of rows, and your browser grinds to a halt. Suddenly, you're staring at the dreaded "Page Unresponsive" error, and everything is frozen. This happens because your browser is trying to do all the heavy computational lifting right there on your machine.
The trick is to stop sorting your raw data directly. A much smarter approach is to use a formula-based sort, like with the QUERY function, on a completely separate summary tab. This way, your massive raw dataset is left untouched, and your computer only has to process the sorted output. It’s a game-changer for performance.
Optimize Your Sheet for Performance
Another performance killer you might not think about is the presence of volatile functions inside the data you're trying to sort. These are formulas like NOW(), TODAY(), or RAND() that recalculate every single time you make a change anywhere in the sheet.
When you try to sort a large range containing these, Google Sheets is forced to re-evaluate them over and over, which adds a huge amount of computational overhead. Before you kick off a big sort, take a minute to remove or minimize these functions in the columns involved. It's a simple cleanup step that can make a massive difference in responsiveness.
The performance wall is real. Beyond just a few thousand rows, especially with complex sorts involving pivots, browser lag becomes a serious issue. This is where you have to think beyond the browser's limitations and consider offloading the heavy lifting.
Handling Massive CSV Imports
If you're dealing with truly enormous CSV files—we're talking hundreds of thousands or even millions of rows—sorting inside your browser just isn't going to happen. The initial import alone is often enough to cause a crash, let alone trying to organize the data afterward.
For these monster datasets, you need a different strategy. Tools designed for heavy data lifting become essential. SmoothSheet, for example, handles the import and sorting process on a server, completely bypassing your browser's memory limits. You can get massive files into your sheet without freezing your computer, and it can even apply your existing formulas to the new data automatically.
If you find yourself constantly battling huge files, it's worth learning how to upload large CSVs to Google Sheets without crashes. It's a practical solution for managing data at a scale that Google Sheets just wasn't built to handle on its own.
Sorting in Google Sheets: Your Questions Answered
When you're getting the hang of sorting in Google Sheets, a few questions always seem to pop up. It's totally normal to hit a couple of snags while learning the ropes. Let's walk through some of the most common issues people face so you can sort your data with confidence.
Think of this as your go-to cheat sheet for troubleshooting the tricky parts and making sure you're using the best method for the job.
Will Sorting Mess Up My Data?
This is probably the most common fear, and it’s a valid one. The answer really boils down to how you sort.
If you head up to the menu and use Sort sheet or Sort range, you are physically changing the order of your original data. One wrong click—like accidentally sorting a single column in a multi-column table—can jumble everything up. It’s a permanent change.
On the other hand, using functions like SORT or QUERY is a much safer bet. These formulas create a brand new, sorted version of your data on the side, leaving your original dataset completely untouched. This is the non-destructive approach I always recommend for building reports or dashboards.
Can I Sort by More Than One Column?
You bet. Sorting by multiple criteria is a must-have for any serious data work, and Google Sheets handles it beautifully.
Just highlight your data and navigate to Data > Sort range. A little window will appear where you can set up your sorting rules.
- First, set your primary sort rule (like sorting by "Region" from A-Z).
- Then, just click "Add another sort column" to layer on a second rule (maybe sorting by "Revenue" from highest to lowest).
This is perfect for when you need to see your sales grouped by region, but also want to see the top-performing deals within each of those regions.
Why Isn’t My Data Sorting Correctly?
Nine times out of ten, when a sort goes haywire, it's a simple formatting issue. Google Sheets is trying its best, but it gets confused by inconsistent data.
The usual suspects are numbers that have been accidentally formatted as text, or dates entered in a mix of different formats (like "10/05/2024" and "Oct 5, 2024" in the same column). A quick trip to Format > Number to standardize the column is almost always the fix.
It's a small detail that can save you a big headache. With Google Sheets now used by over 1.1 billion people, and with 87% of them collaborating on sheets weekly, keeping your data clean is crucial for everyone involved. You can find more cool Google Sheets usage statistics at electroiq.com.
My Pro Tip: Before I do any major sort on important data, I always make a quick backup. Just right-click the sheet tab and hit "Duplicate." If anything goes sideways, you’ve got a one-click undo button ready to go. No stress, no panic.
If you're wrestling with massive CSV files that make Google Sheets choke, SmoothSheet is designed to handle those huge imports. It can sort millions of rows right in your browser without the freeze-ups. Learn more at SmoothSheet.